CIM (2014) definitions were followed for Mineral Resource Estimates (MRE).
The effective date of the MRE for Corner Bay, Devlin and Joe Mann is March 30, 2022.
The effective date of the MRE for Cedar Bay is December 31, 2018. The MRE prepared by QP Luke Evans, M.Sc., P.Eng, ing., of Roscoe Postle Associates Inc. (now SLR Consulting (Canada) Ltd.). Mineral resources are estimated at a 2.9 g/t Au cut-off and using a gold price of US$1,400 oz and FX rate of US$1.00:C$1.25. Min. mining width of 2 m was used. Bulk density of 2.90 t/m3 was used. Refer to Technical Report on the Corner Bay and Cedar Bay Projects, Northwest Québec, Canada dated June 15, 2019.
Mineral Resources are estimated using an exchange rate of US$0.75/C$1.00.
Mineral Resources at Joe Mann are estimated using a long-term gold price of US$1,800/oz Au, and a metallurgical gold recovery of 83%. Mineral Resources at Corner Bay and Devlin are estimated using a long-term copper price of US$3.75/lb, and a metallurgical copper recovery of 95%.
Mineral Resources are estimated at a cut-off grade of 2.60 g/t Au at Joe Mann, 1.3% Cu at Corner Bay and 1.2% Cu at Devlin.
A minimum mining width of 1.2 m was used at Joe Mann and a small number of lower grade blocks have been included for continuity. A minimum mining width of 2.0 m was used at Corner Bay, and a minimum height of 1.8 m was applied at Devlin.
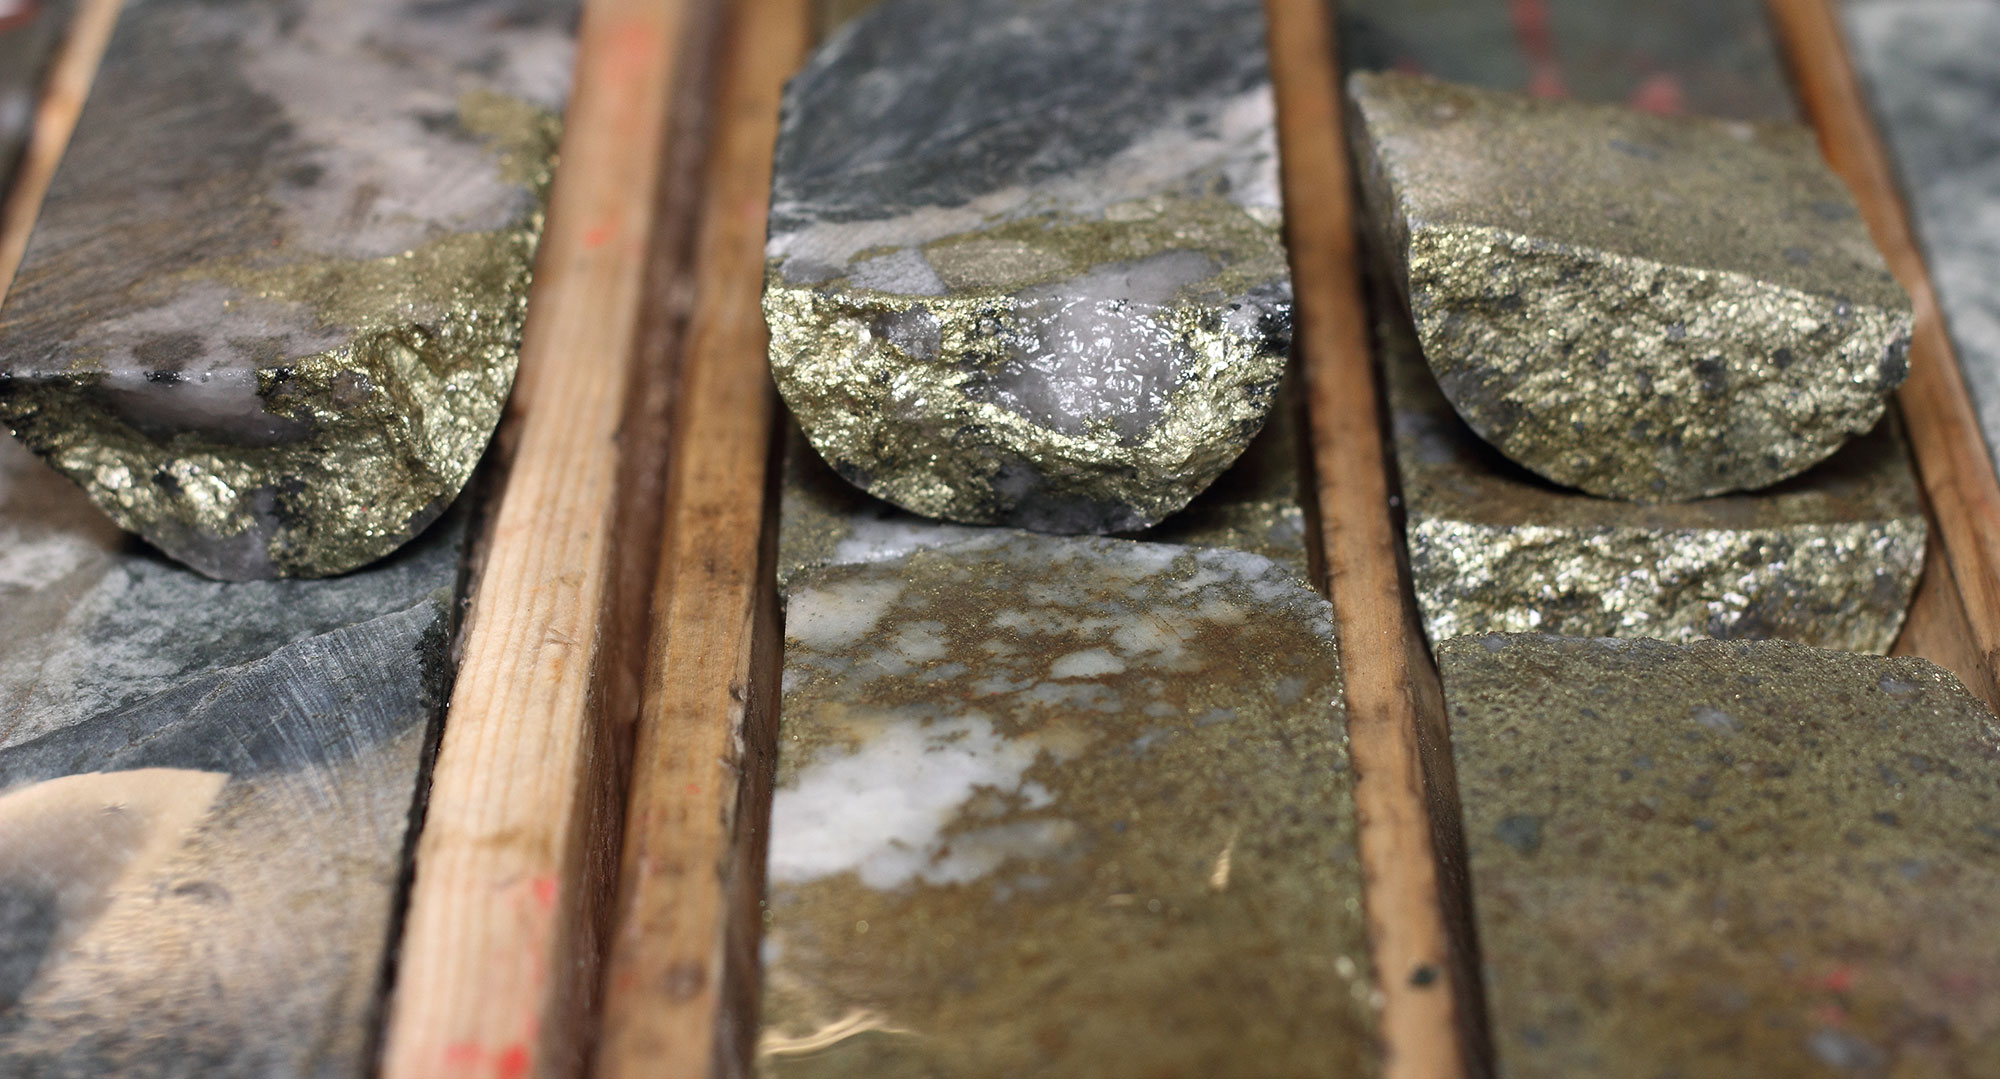
Bulk density ranges by deposit and vein from 2.84 t/m3 to 3.1 t/m3.
Mineral Resources that are not Mineral Reserves do not have demonstrated economic viability.
Numbers may not add up due to rounding.
Historical Resources
Deposit
Category
Tonnage
Grade
Contained
000 tonnes
% Cu
g/t Au
M Lbs Cu
000 oz Au
Copper Rand (2007)
Proven
209
1.92
2.40
8.8
16
Probable
762
1.55
3.19
26.9
78
Proven & Probable
971
1.67
2.91
35.6
94
Measured
94
1.23
2.09
2.6
6
Indicated
536
1.39
2.98
16.4
51
Measured & Indicated
630
1.37
2.84
18.9
58
Inferred
416
1.89
2.78
17.3
37
Notes:
Campbell Resources, Dec.31, 2007. Data verified by V. Larouche, Chief Geologist for Campbell. Economic parameters: gold price of US$800/oz, copper price of US$2.75/lb and FX rate of US$/C$=1.00. All high gold grades brought back to 0.40 oz/t Au. All high copper grades brought back to 6.0%. Mineral Resources are estimated at a 1.6% Cu cut-off grade. Cut-off determined by using a copper price of US$3.25/lb. Method used, polygon on orthogonal projection. Cut off = $58 NSR; Mill recovery: gold = 81.33% and copper = 96.6%.
The Copper Rand mine closed in December 2008. The Proven Reserves reported in the table were adjusted from the published Mineral Reserves at year-end 2007 by subtracting the total mined tonnes in 2008 (data sourced from Q3 MD&A 2008 and internal reports for Q4 2008). The ore mined in Q4 2008 was selectively high-grade and most likely brought down the remaining grade of the Proven category; accurate calculations of the copper grade of the remaining ore in the Proven category is not possible as no reconciliation was done at year-end 2008. Other categories remain unchanged. The data has been converted from short tons to tonnes (x 0.907) and from oz/short ton to g/t (x 34.28).
Measured and Indicated Mineral Resources are exclusive of Mineral Reserves. Mineral Resources are not Mineral Reserves and do not have demonstrated economic viability.
This estimate is considered to be historical in nature and should not be relied upon. A Qualified Person has not completed sufficient work to classify the historical estimate as a current Mineral Resource or Mineral Reserve. The Company is not treating the historical estimate as current Mineral Resources or Mineral Reserves.
Our website uses cookies to provide you with an optimal and relevant experience. By accepting, you give your consent in accordance with our privacy policy.Accept